Methane Hydrate Transport
Methane hydrates are ice-like crystals consist of methane gas molecules trapped inside the water cages. They are stable under the low temperature and high pressure regions such as in arctic regions under permafrost and in ocean sediments along the continental slopes. Possible severe risks caused by the formation of methane hydrate inside the deepwater oil and gas pipelines motivated the study in the behavior of methane hydrate formation.
I used the data collected at the Ulleung Basin Sites [PHTK2016] for following simulations in 1D.
I used the data collected at the Ulleung Basin Sites [PHTK2016] for following simulations in 1D.
Advection of Methane Gas in GHSZ for Homogeneous Sediment
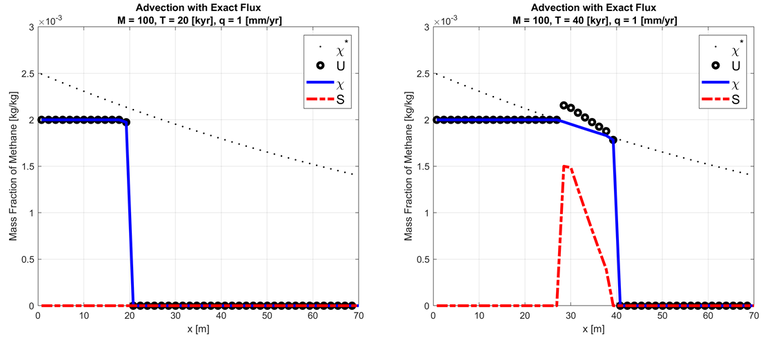
Gas hydrate stability zone (GHSZ) is where only liquid and hydrate phases are present. I assumed the constant supply of methane gas from the center of the earth (x increases towards the seafloor) and no other source of methane gas. When the mass fraction of methane gas in the liquid phase reached its maximum solubility (depends on pressure, temperature, salinity, and rock type), all excessive methane gas would form hydrate. I used the first-order Godunov's scheme to get the total mass contents per mass of liquid phase. Then I used the local phase behavior solver to get the mass fraction of methane in the liquid phase and hydrate saturation.
Advection of Methane Gas in GHSZ for Heterogeneous Sediment
|
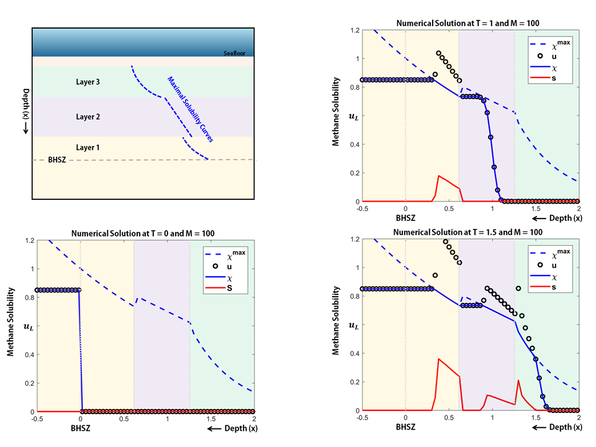
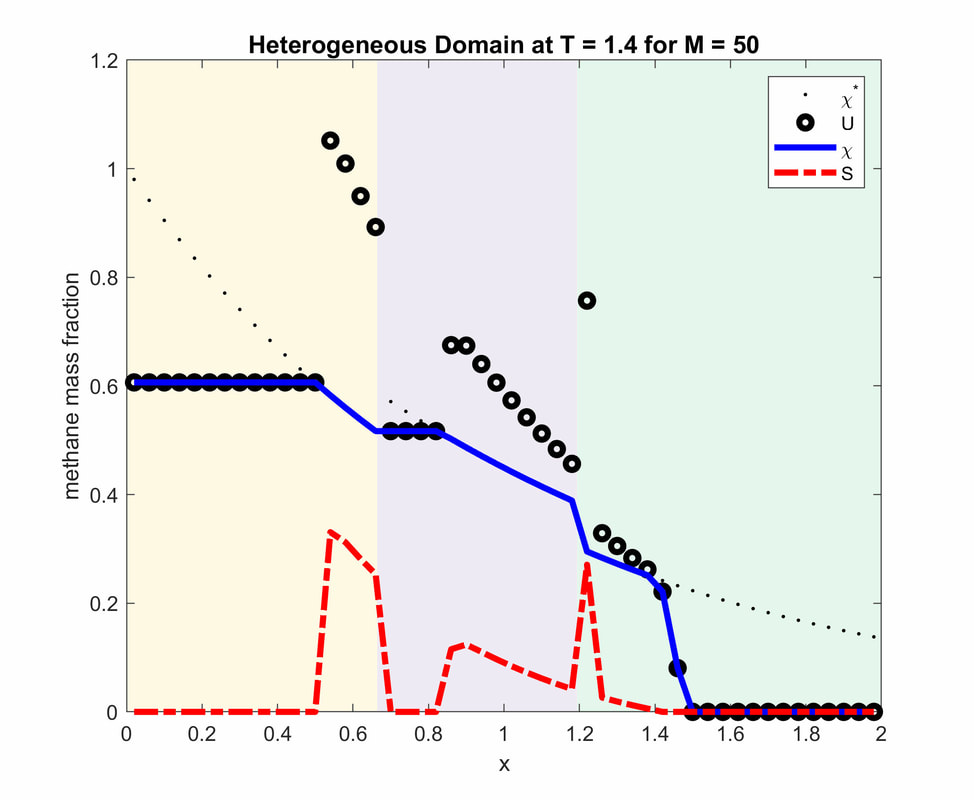
This example is inspired by the 1D case study and model given by Daigle and Dugan [DD2010]. For simplicity, I used the model data instead of the real data. Each layer has different physical property such as porosity and permeability which implies to have different maximum solubility of methane gas.
|
Methane Gas Transport at Darcy Scale
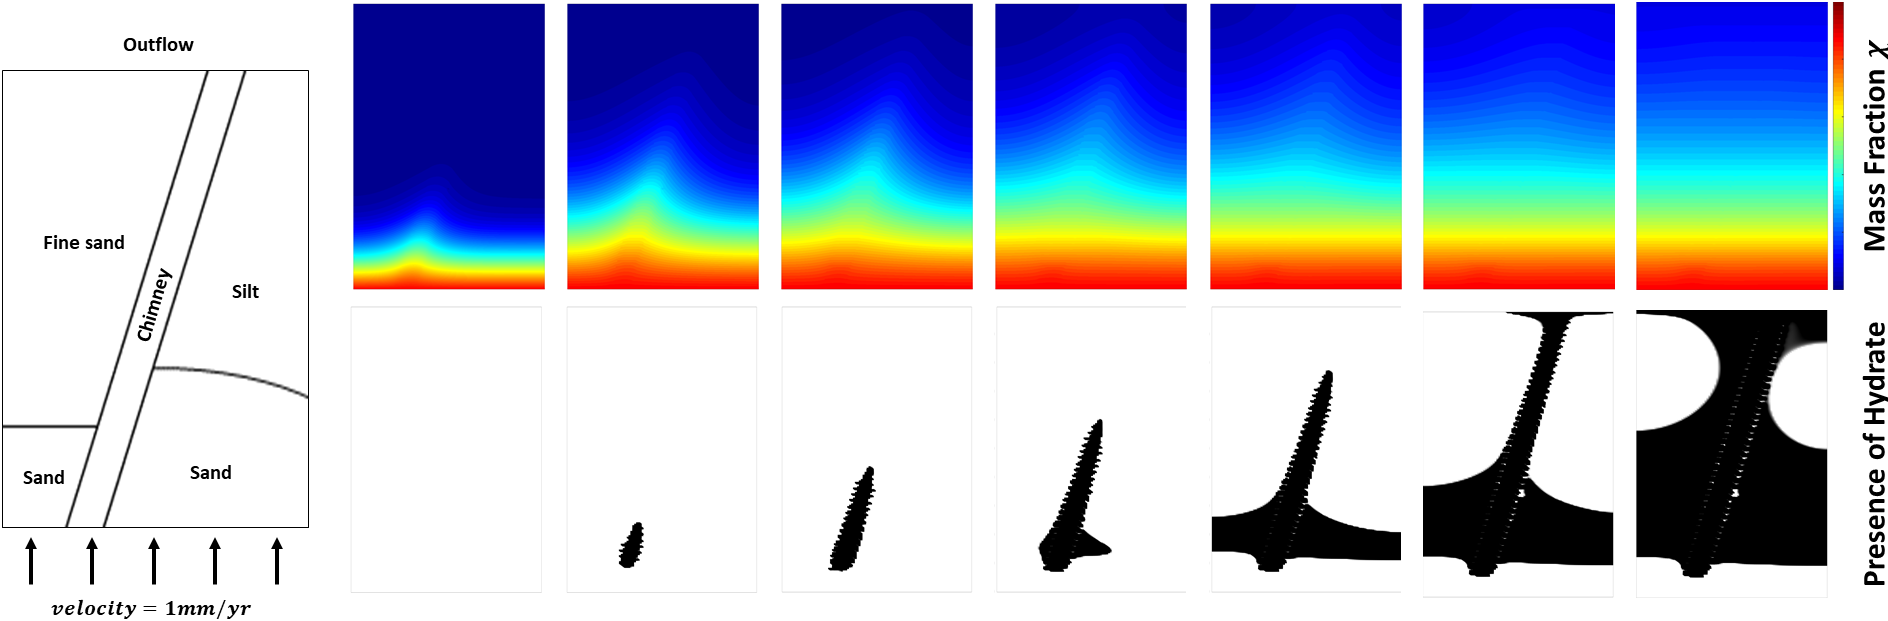
(Diagram on the left) Schematic diagram of heterogeneous rock. Assume the constant supply of methane gas from the center of Earth through BHSZ. Sand, fine sand, silt, and chimney have different permeabilities.
As time goes, the mass fraction of methane gas dissolved in the liquid phase propagates in an upward direction towards the seafloor. Since the permeability in the chimney is much larger than other rock types, we can observe the high mass concentration in the region of chimney compare to the surroundings. As consequences, we first see the hydrate formation in the chimney as maximum solubility can be reached at the earlier stage than in sands. Moreover, since the permeability of silt is greater than that of fine sand, more methane concentration left behind in the sand on the right side of chimney than the left side of chimney. Thus, hydrate forms in the sand on the right side of chimney before forming on the left. Note that the 'spiky' shapes in black are due to the low-resolution.
As methane gas leave the domain, we see hydrate formation as a consequence of undercooling (depression of hydrate melting point) which is expected; see, e.g., [Rempel 2011] .
A. W. Rempel, "A model for the diffusive growth of hydrate saturations anomalies in layered sediments." Journal of Geophysical Research, 116 (2011)
Stokes Flow in Porous Media
.I consider the steady-state Stokes equations in porous media with parabolic inflow boundary condition and natural outflow boundary condition. Numerical solution is obtained by using the MAC scheme which is a direct discretization using second order finite differences on a staggered grid. My code was written in MATLAB which is capable of generating numerical solutions with input image of any porous media.
Numerical solution of velocity profile in the porous media generated by MAC scheme
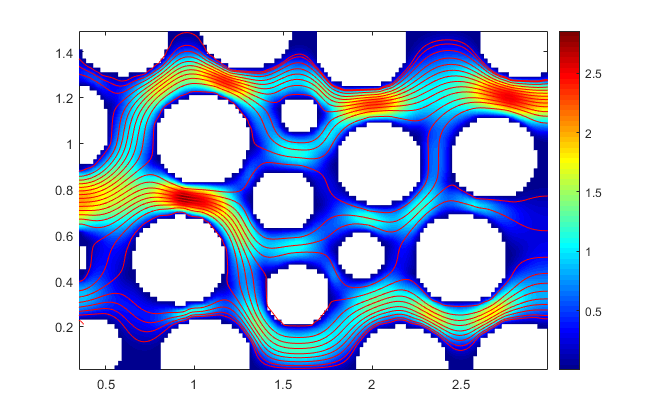
Example 1: 2-dimensional Stokes flow
in a randomly generated porous media |
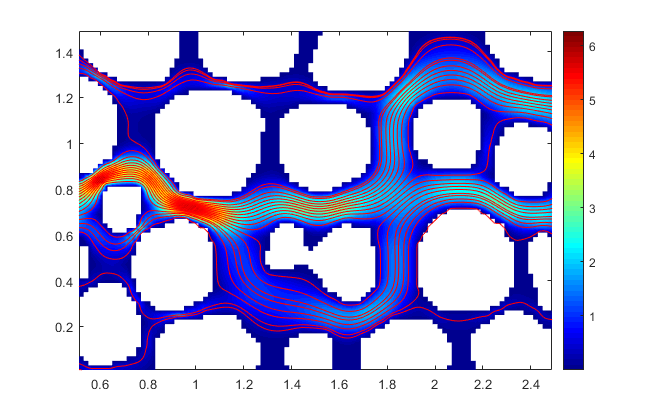
Example 2: 2-dimensional Stokes flow in a porous media
obtained from glass beads experiment |
|
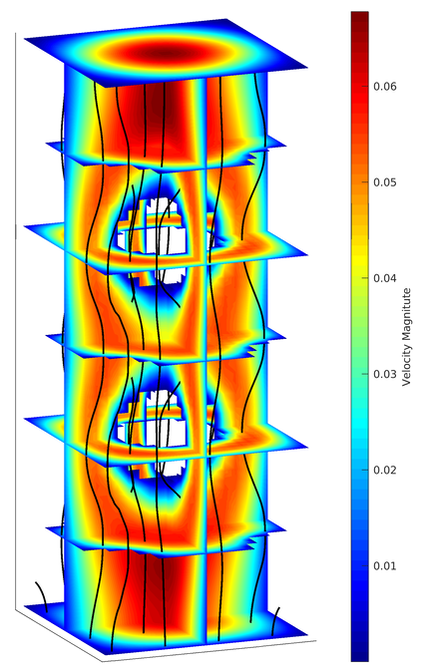
Example 3: 3-dimensional Stokes flow
in a porous media 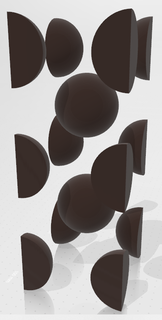
Consider a 3-dimensional from through a porous media (above figure) with paraboloidal inflow boundary condition at the bottom and no-slip boundary condition on the lateral walls. I used the natural boundary condition at the top (outflow). The figure on the right shows the velocity of fluid with streamlines in black.
|
|
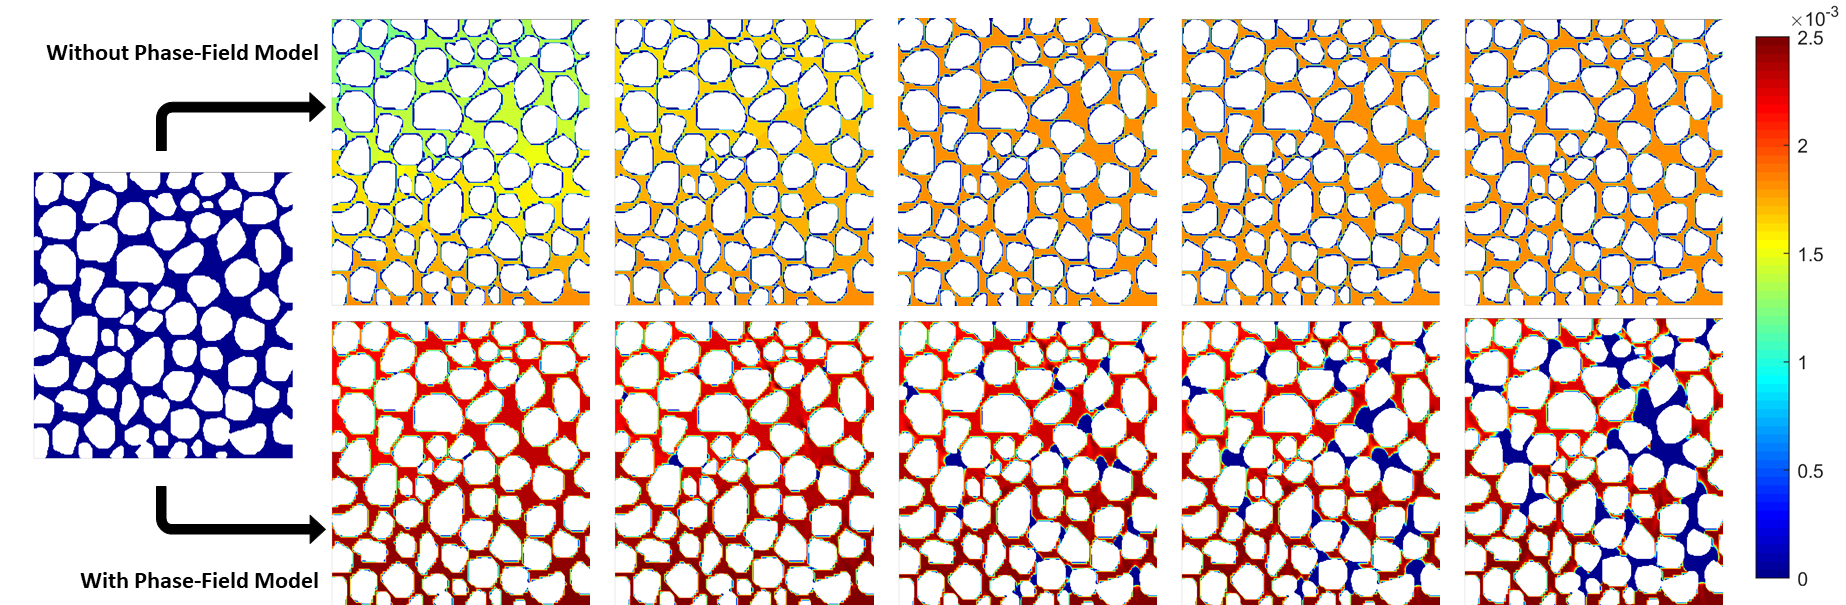
Hydrate Formation in Sand with and without the Phase-Field Model
The methane gas transport in GHSZ is highly diffusive flow. Hence, if we simulate the advection-diffusion transport in the sand, it is unlikely to see any hydrate formation in pores. Above figures have rock in white and methane fraction in color (blue to red). Upper row of figures show the evolution of methane concentration over 100 kyrs. Since the methane concentration never reaches the maximum solubility, we don't see any hydrate formation. In reality, hydrate can present in the pores. To simulate hydrate formation in the pores, we run the simulation of methane gas transport using a coupled transport-phase-field model. The bottom 5 figures show the special case of the evolution of methane concentration over 100 kyrs. When the advective velocity takes over the diffusion rate at narrow necks of pores, the methane concentration can exceed the maximum solubility and hydrate forms (blue).
